
What can a user do with this report?
-
Discern busy and quiet times to schedule training sessions or classes or schedule maintenance.
-
Identify low/high saturated equipment to help make key decisions, such as:
-
Removing some under utilized equipment and add more over utilized models to help balance the club.
-
Add additional equipment to ensure that there are never waits for the members.
-
Remove equipment to make room for functional training or additional equipment.
-
Raise awareness or promote equipment that are under utilized
-
-
Run the report quarterly to review and compare the change and hone in on the perfect equipment saturation level for the club.
Report Overview:
-
This report allows a user to review in-depth equipment saturation data.
The Overview Page


-
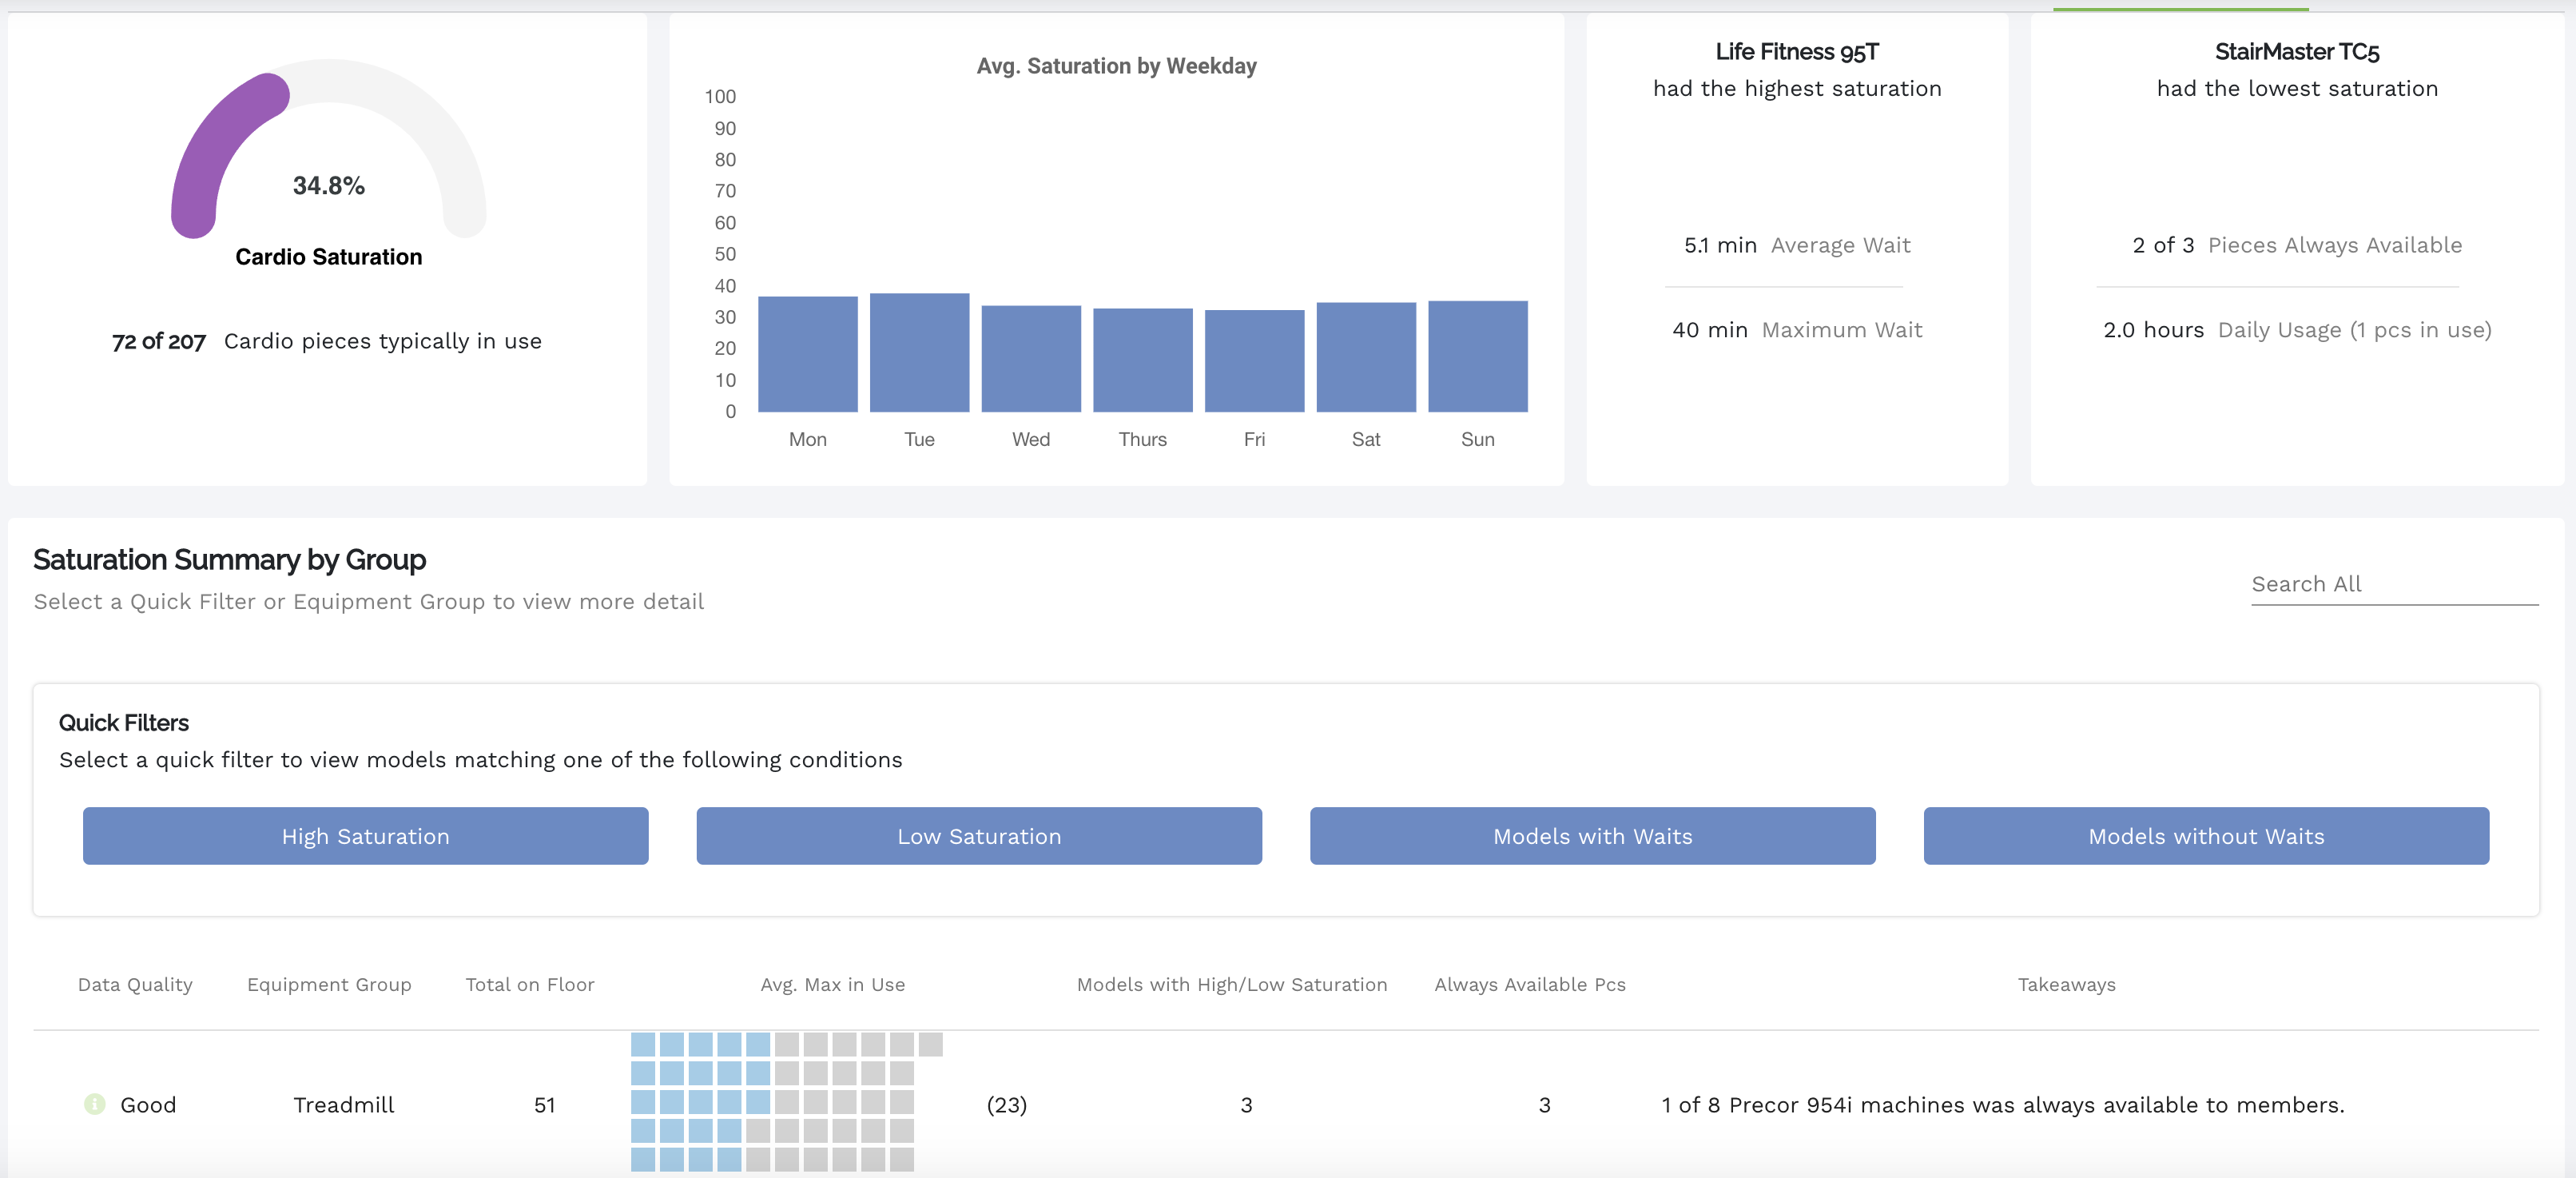
Report starts as a high level overview showing:
-
Total Cardio/Strength saturation during the selected time period.
-
Average Saturation across cardio/strength equipment by weekday.
-
The Most Saturated model for the time period.
-
Shows the average wait time that a member could have experienced for this equipment during the time period.
-
Shows the maximum wait time that a member could have experienced for this equipment during the time period.
-
-
The least saturated model for the time period.
-
Shows how many pieces were always available during the time period.
-
Shows the daily usage of the model at its highest concurrent pieces in use for the time period.
-
-
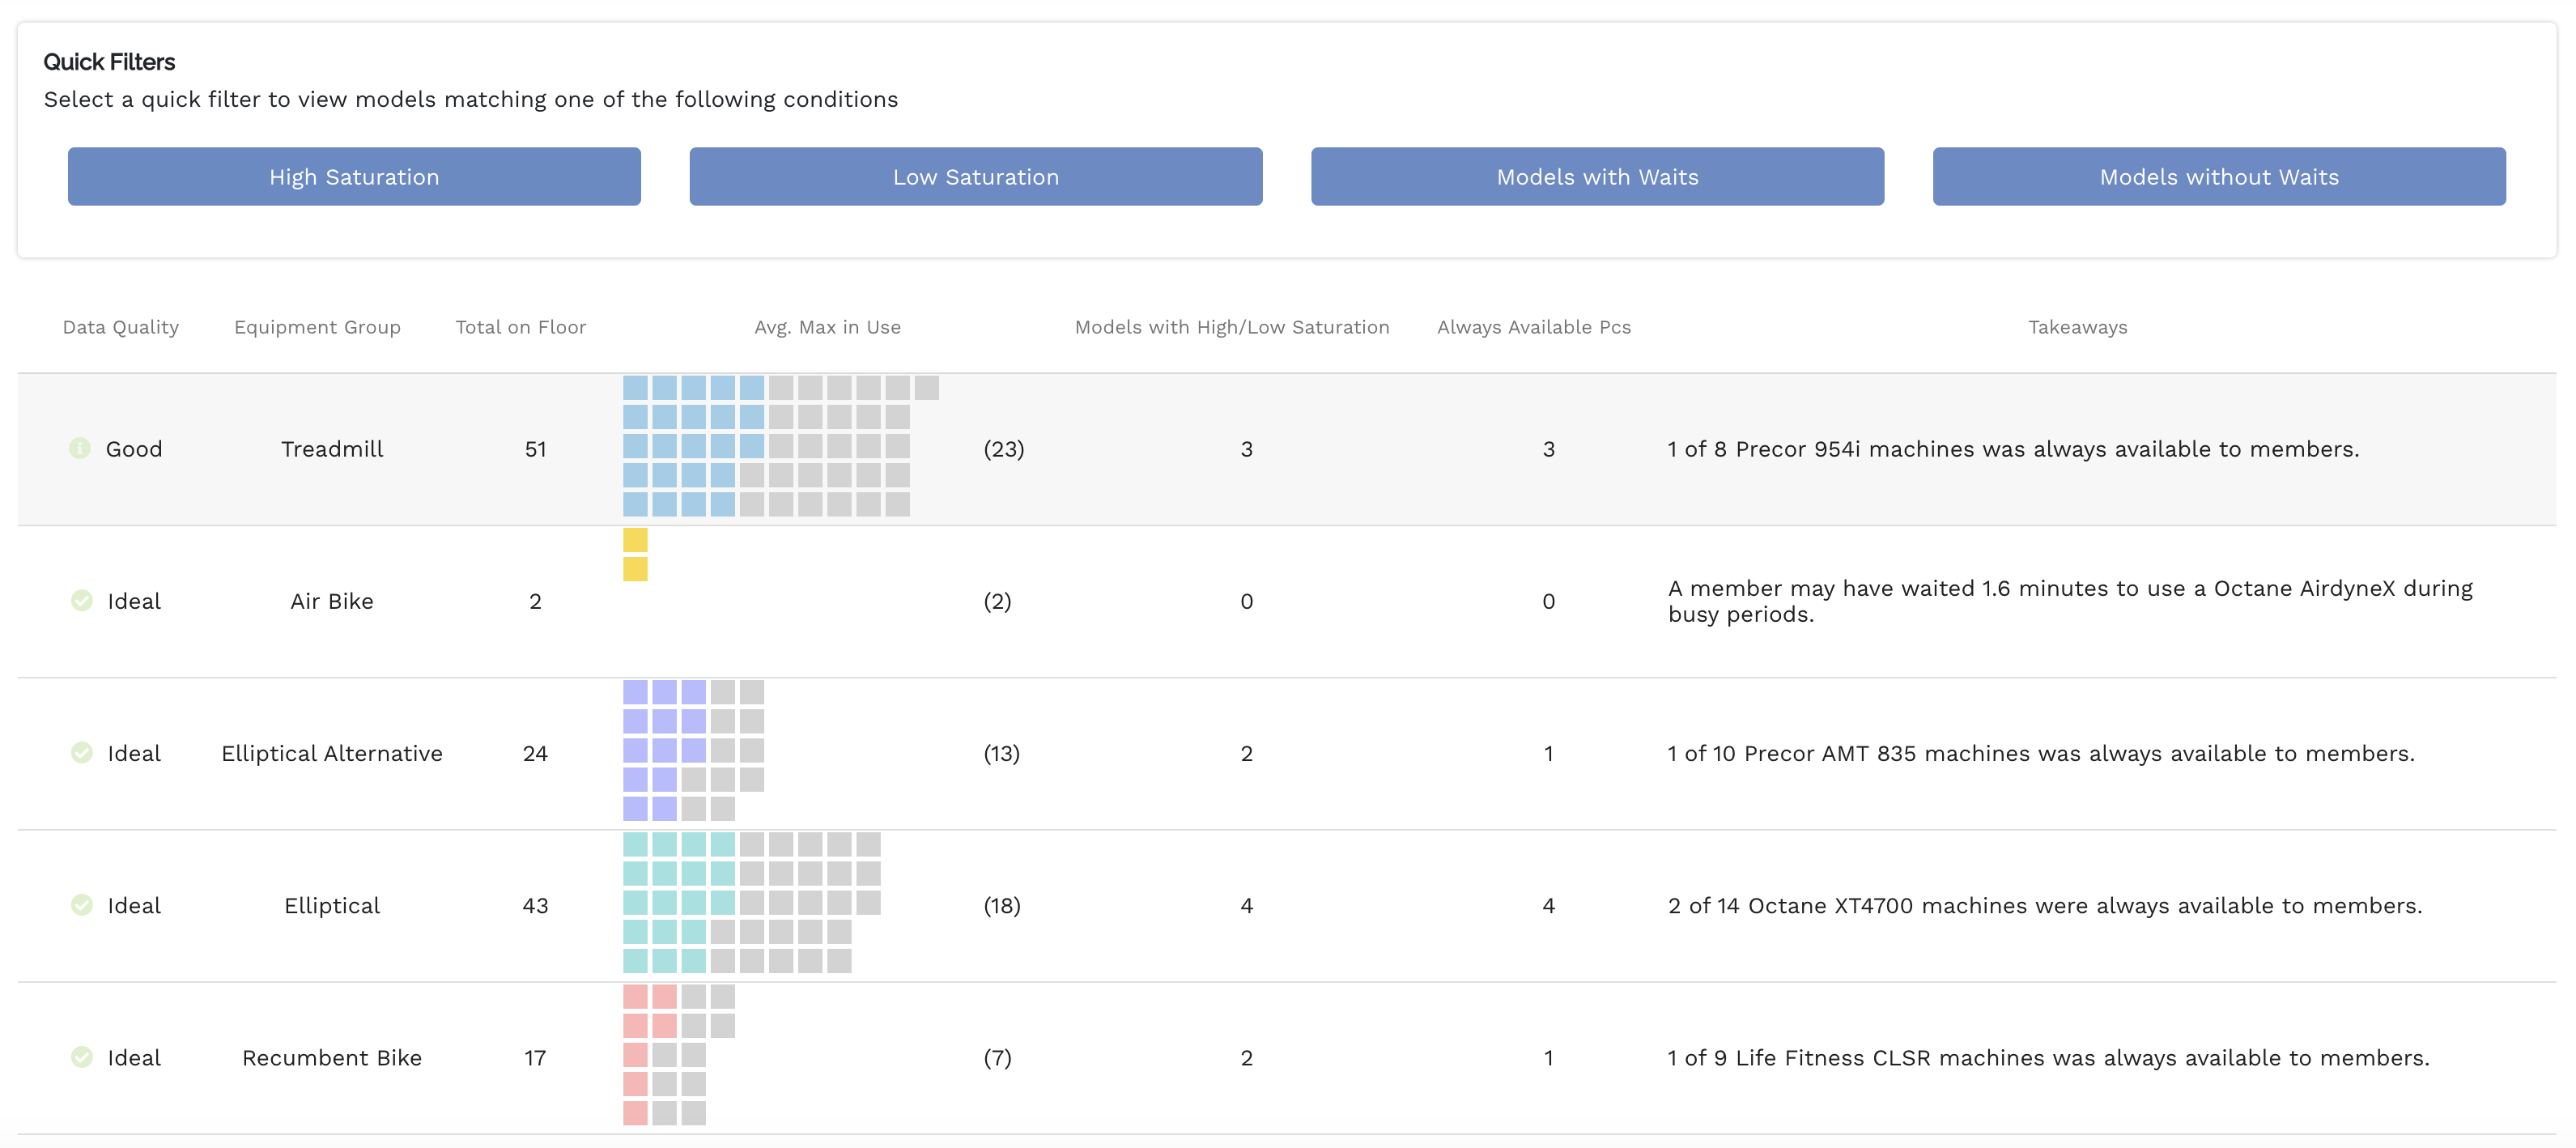
An in depth saturation breakdown of all present equipment groups (treadmills, ellipticals, upright bikes, etc.)
-
Equipment data quality.
-
This is a breakdown of the data quality received from the equipment.
-
Ideal: Equipment reported good data for the duration of the time period.
-
OK: The equipment had some connection issues during the time period.
-
Poor: The equipment experienced major connection issues during this time period.
-
-
-
Key takeaways based on the saturation data, examples:
-
5 of 18 Woodway 4Front machines were always available to members.
-
1 of 3 Octane LX8000 machines was always available to members.
-
-
Quick Filters
-
Allows a user to filter models for High Saturation, Low Saturation, Models with Waits, Models without Waits
-
-
The Detailed Model Breakdown
A user can select either a quick filter or equipment group to view detailed model information. This breakdown follows the same format as above but with a focus on the selected parameter.

Data Shown:
-
Data Quality
-
Model
-
Total count of each model on the floor.
-
The Avg. Max in use (saturation) for the models.
-
Daytime peak hours
-
When the equipment in the club is its busiest.
-
-
Daytime Quiet Hours
-
When the equipment in the club is the quietest. A user could use this info to plan maintenance for their club to ensure minimal disruption to members.
-
-
Overall model saturation
-
Low
-
Balanced
-
High
-
-
Key Takeaways - Examples:
-
“33.3% of total waits occurred during the hour of 11am.”
-
“100.0% of max saturation instances occurred during the hour of 6pm.”
-
Max Hourly Saturation - Selected Model
Selecting a model from the table will show a maximum hourly saturation graph showing the typical maximum saturations by hour(avg. max in use) and the maximum recorded saturation for that model.
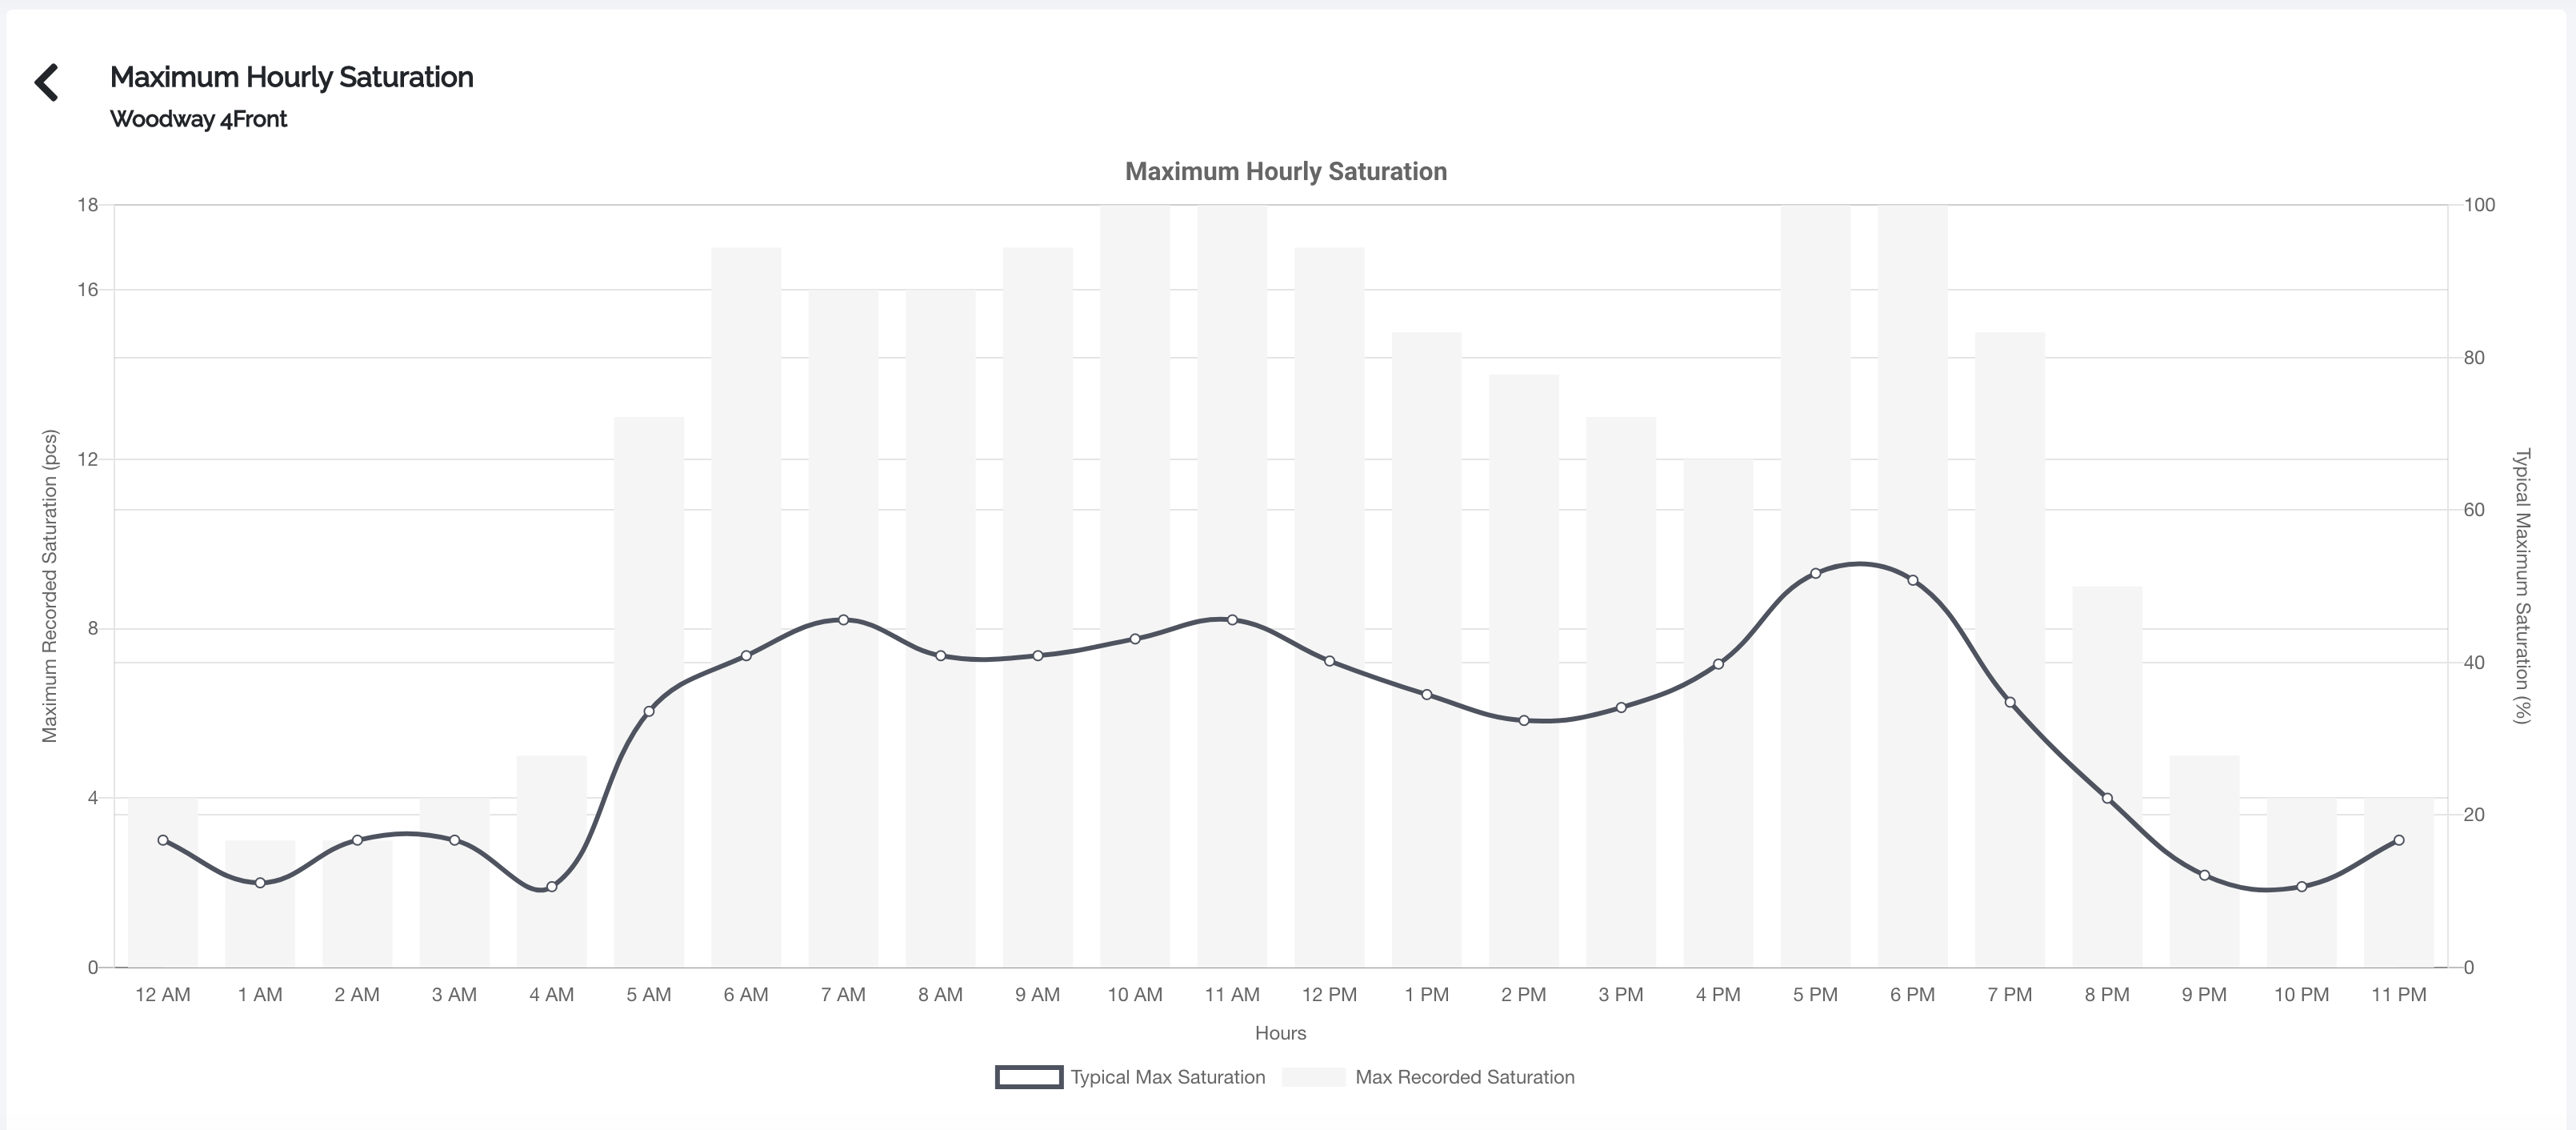

This level also shows additional and more in-depth takeaways, such as:
There were 189 sessions (6-7/day) for this model group during the reporting period.
22.7% of total sessions occurred during the top 3 daytime peak hours (10am, 2pm, 6pm).
The longest session occurred during the hour of 10am and lasted 59 mins.
The average session time for this machine is 15.0 minutes.
Sessions exceeding 20 minutes occurred 1-2 times per day.
Comments
0 comments
Please sign in to leave a comment.